St. Louis County Residential Real Estate Market Update — February 2014 vs. February 2015

Home prices were up in St. Louis County in February as compared to one year ago.  With the Median Sold Home price at $150,000, this represents an increase of 11.1%.

Median Price of SOLDs Feb 2014 v Feb 2015


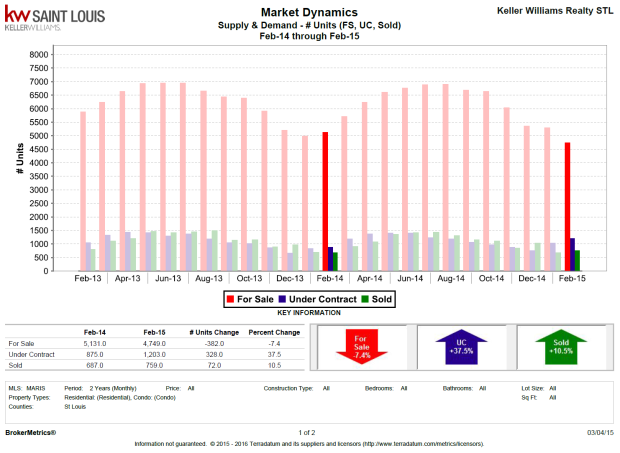
In addition to median home prices being up, we also noted a sharp increase of units sold — up 10.5% to 759 units in February 2015 vs. 687 units in February 2014.  Some of this increase may be due to a milder January 2015 as compared to the snowy January 2014.

Supply and Demand # Units (FS, UC, Sold) Feb 2014 v Feb 2015

It is also important to note that the Months of Inventory in St. Louis County fell in February to 2.6 months. This indicates a strong Seller’s Market.

Months Supply of Inventory of Under Contract Properties Feb 2014 v Feb 2015


  1. Median Price of SOLDs Feb 2014 v Feb 2015
  2. Months Supply of Inventory of Under Contract Properties Feb 2014 v Feb 2015
  3. Sales Absorption Under Contract and Sold Feb 2014 v Feb 2015
  4. Supply and Demand # Units (Expired, New) Feb 2014 v Feb 2015
  5. Supply and Demand # Units (FS, UC, Sold) Feb 2014 v Feb 2015
  6. Average DOM vs CDOM for Under Contract Properties Feb 2014 v Feb 2015
MTD Numbers for February

Wow.  Check out these “Almost end of the month” results for February.  You guys are killing it!!

Screenshot 2015-02-25 05.53.47


The slide below shows how our business has grown as compared to last February.

Screenshot 2015-02-25 05.57.15


KW All Across St. Louis vs. The MLS

For our Career night, last night, I prepared a KW All St. Louis vs. the MLS statistical report.  It’s encouraging to see that all 4 KW offices, taken collectively, are outperforming the market so well.  You expect the same great service no matter which Nordstom you frequent.  You expect the same comfortable bed at every Westin Hotel.  Well, I think we’ve proven that KW systems, when implemented properly, work.  See below.
All STL LORE 2013-2014

An Historic Day for Keller Williams Realty Saint Louis

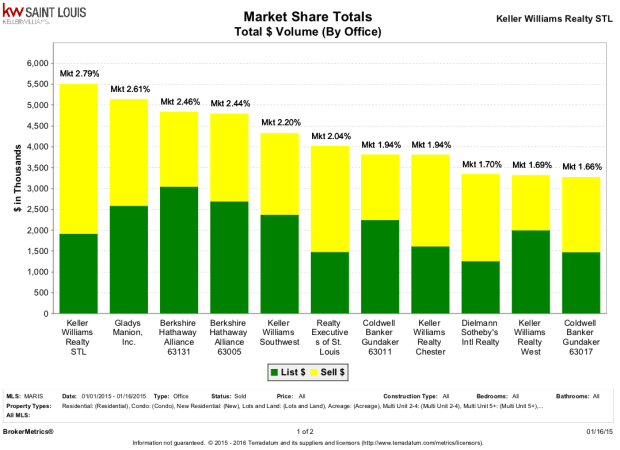
We’ve been looking at Market Share reports for the past three years.  And today we have an exciting new statistic to share.  In the past, we’ve seen YTD reports that show us as the number 1 office in town.  Unfortunately, we’ve failed to hold on to that lead as we progress through the year.  We’ve ended each of the past three years in the number 2 spot for sales volume.  That said, we’ve closed the gap each year.  In fact, last year, we ended the year just $2M behind the number 1 market share company.

Today, I believe, marks a turning point for our business.  Based on closed sales volume over the past 365 days, we are the Number 1 office in Saint Louis by market share.  Yes, we’re number one year-to-date, AND we’re number 1 for the past full year.   This is a first for us.  See below.

Screenshot 2015-02-24 03.50.53 Screenshot 2015-02-24 03.51.31

So you might be thinking, “How can we remain confident that we will hold that Number 1 position?”  Check out the data below.  It shows that over the past 365 days, we have grown our business by 16.41% in a market that has increased by 6.4% — so we’ve OUTPERFORMED the market in Closed Sales Volume by 10%.  CBG Town and Country has decreased by 5.82% in the same area — underperformance of 12.2%.

Our trajectory is growth.  We’ll continue to pull away from them as the year progresses.

Screenshot 2015-02-24 03.51.50Screenshot 2015-02-24 03.52.01

I also want to draw your attention to the secret to our success.  Over the past year, we’ve grown our listing inventory by 23.94% in a market that grew by 7%.  While we’ve increased our Listings Taken Volume, our biggest competitor shrank theirs by 14.5%.  So we’re focusing on the activities that make a difference for a real estate company.  Congratulations AND keep pushing!!

Screenshot 2015-02-24 03.52.16Screenshot 2015-02-24 03.52.27

I’m really proud to be in business with such a talented group!!

Halfway through January Update

January is half over.  And I wanted to share some updates with you.  You guys are off to a great start — quickly taking the Number 1 spot in the market in both Total $ Volume of sales and Total Number of Units sold.  Great Job!  See below.

In addition, we’re KILLING IT in Listings Taken.  We’re up over 69% in Listings Taken Volume and over 51% in Listing Units Taken as compared to the same time period last year.  In both areas, we’re outperforming the market by more than 50%.  And we’ve taken more listings than any other office in town!  See below.

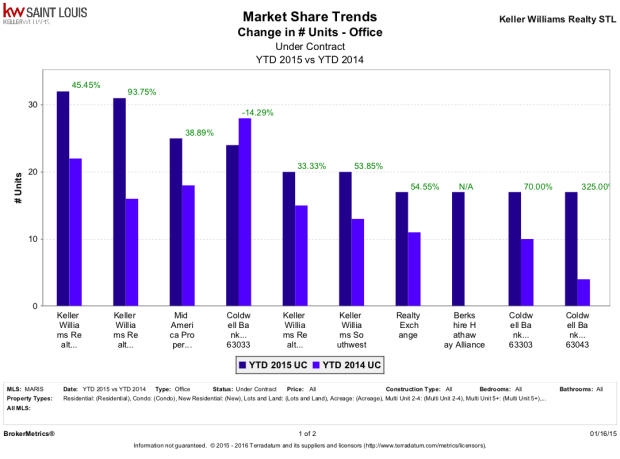
Finally, we’ve put more real estate under contract since January 1 than any other office in the area — and we’re outperforming last year by more than 40%.  See below.

We’re off to a great start and I’m excited to see what the rest of January brings!!

\Screenshot 2015-01-16 03.46.12Screenshot 2015-01-16 03.46.54Screenshot 2015-01-16 04.15.09Screenshot 2015-01-16 04.14.10 Screenshot 2015-01-16 04.25.18 Screenshot 2015-01-16 04.26.11

Market Snapshot for December 15, 2014


Market Snapshot 141215


Please see the following reports: